
Prior research suggests that online instructors seem to be judged, first and foremost, on the clarity and completeness with which their unit details are presented (Conrad, 2002).
It might be because students tend to experience more anxiety when studying online due to diminished social cues and increased uncertainty (Conrad, 2002). Therefore, clear communication about the unit structure and expectations are keys to successful online teaching.
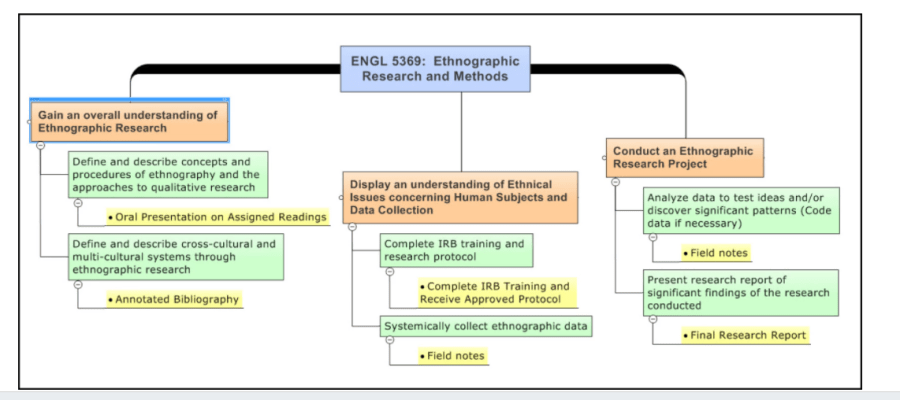
Graphic syllabus/ a learning outcomes map
One strategy to consider is graphic syllabus and a visual learning outcomes map. Below are some examples of what these might look like.


Why does it work?
Visually representing a sequence of learning outcomes helps students better understand the structure of your course and see how things are interrelated (Biktimirov & Nilson, 2003), which can reduce confusion and make a positive contribution to student learning experience (Mikhailova, 2018). It can also reduce the number of questions you receive about your course, which is a win-win!
How can I do it?
Feel free to use these 5 MQ-coloured templates to create your visual syllabus (PowerPoint templates).

Interested in creating a map-like visual syllabus?
Try Bubbl or Lucid Chart. Both of them allow up to 3 visuals for free. You can also use a free version of MindMup.
Looking for something else? Check out these free templates. 4 weeks at a time and 8 elements timeline.
With a large number of free templates and resources, it is becoming increasingly easy to create visual ‘learning maps’ for your students – something that many of them will appreciate, especially at the time of learning online.
References:
Biktimirov, E. N., & Nilson, L. B. (2003). Mapping Your Course: Designing a Graphic Syllabus for Introductory Finance. Journal of Education for Business, 78(6), 308-312. doi:10.1080/08832320309598618
Conrad, D. L. (2002). Engagement, excitement, anxiety, and fear: Learners’ experiences of starting an online course. The American journal of distance education, 16(4), 205-226.
Mikhailova, E. (2018). Enhancing soil science education with a graphic syllabus. Natural Sciences Education, 47(1), 1-6.
Image credits: Marymarkevich at Freepik
[…] visually present key milestones. See this post on humanising online teaching and this post on Graphic syllabus resources which has some […]
[…] Convening a unit? Here are graphic syllabus resources for you […]
[…] Convening a unit? Here are some graphic syllabus resources for you […]
[…] a written overview and infographic (graphic syllabus) with milestones to clarify the unit structure and key dates. This approach […]